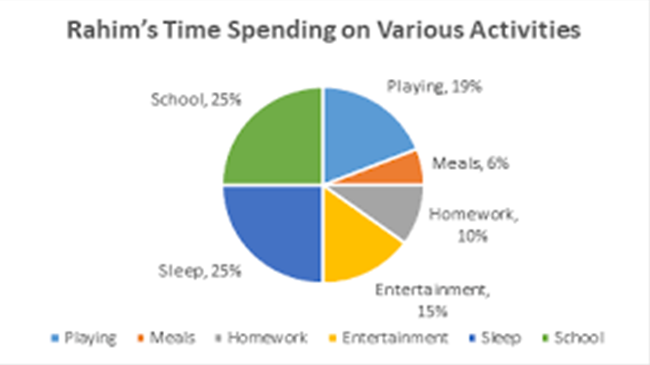
The graph shows Sumi’s time spending on different activities
The graph shows Sumi’s time spending on different activities. Write a paragraph describing the information of the following graph.

Answer: The graph shows Sumi’s time spending on different activities. In general, she spends most of her time in school and sleeping. She spends 25% of total time in sleeping and the same in school. She gives the least time in meals, which is only 6% of her time.
Besides, it is seen from the graph that she spends 15% time in entertainment, 10% in homework and 19% in playing. So it can be said that she also spends much of her time in entertainment and playing but less in homework. She should be more serious regarding educational activities. Entertainment is necessary but education is the basic human rights to enjoy all other rights.

