Rearrange SSC Part: 2
REARRANGING SENTENCES. IT IS NOT A TOUGH ONE. THE ONLY WAY TO MASTER OVER THIS ITEM IS TO PRACTISE MORE
Read More

REARRANGING SENTENCES. IT IS NOT A TOUGH ONE. THE ONLY WAY TO MASTER OVER THIS ITEM IS TO PRACTISE MORE
Read More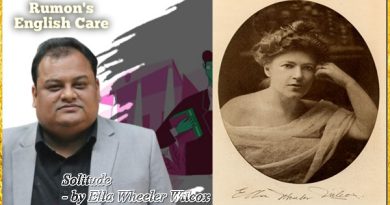
Solitude by Ella Wheeler Wilcox Laugh, and the world laughs with you; Weep, and you weep alone; For the sad
Read More
The Sands of Dee -by Charles Kingsley “O Mary, go and call the cattle home, And call the cattle home,
Read More
Books -by Eleanor Farjeon What worlds of wonder are our books! As one opens them and looks, New ideas and
Read More
O Me! O Life! -by Walt Whitman Oh me! Oh life! of the questions of these recurring, Of the endless
Read More
The Lake Isle of Innisfree by W.B. Yeats I will arise and go now, and go to Innisfree, And a
Read More
The Tyger (by William Blake) Tyger Tyger, burning bright In the forests of the night: What immortal hand or eye,
Read More
Ozymandias -by Percy Bysshe Shelley I met a traveler from an antique land Who said: Two vast and trunkless legs
Read More
Dover Beach -By Matthew Arnold The sea is calm tonight. The tide is full, the moon lies fair Upon the
Read More
To a Skylark -By Percy Bysshe Shelley Hail to thee, blithe Spirit! Bird thou never wert, That from Heaven, or
Read More