

Describing the Graph of The Average Temperatures of The Year
01. Describing the Graph of The Average Temperatures of The Year
Question: The graph below shows the average temperature of the year 2012 in Bangladesh. Describe the graph in 150 words. You should highlight and summarize the information given in the graph.
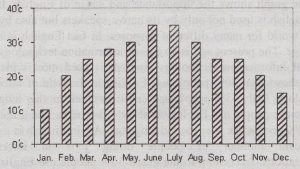
Average Temperatures of the year, 2012
Answer: The graph shows the variations in temperatures at different months of the year. According to the chart, the lowest temperature is in the month of January, and it is 10-degree centigrade. The highest temperature of the year has been shown in the months of June and July, and it is 38-degree centigrade. The graph shows that there is a gradual rise in temperature from January to June. During this time the temperature varies from 10-degree centigrade to 35-degree centigrade. In June and July, the temperature remains unchanged. But from July the temperature begins to fall gradually and this trend continues till January. However, the similarity of temperatures is noticeable in some months. May and August have almost the same temperature and it is around 30-degree centigrade. Again, April and September have similar temperatures and it is more or less 27degree centigrade. Also, the temperature is almost the same. March and October. Thus, the graph shows the rise and fall of temperature from January to December.
02. Describing the Graph of The Average Temperatures of The Year in Bangladesh
Question: Write a paragraph describing the information of the following graph.
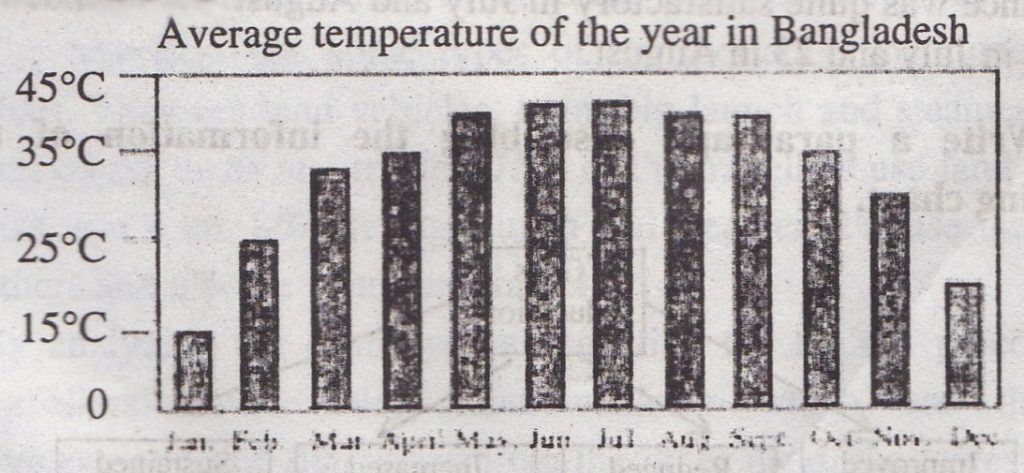
Answer: The graph shows the average temperature of the year 2015 in Bangladesh. The month-wise temperature was as follows:
January 15°C, February 25°C, March 33°C, April 35°C, May 39°C, June 40°C, July 40°C, August 37°C, September 39°C, October 35°C, November 30°C, December 20°C. The graph also shows that the lowest temperature of the year was in January and the highest was in June and July. From February to September the temperature increased drastically. In October and November, the temperature decreased slightly. But in December and January, there was a noticeable decrease in temperature. LEI Write a paragraph describing the information of the following graph.